Story
How will global warming and emissions affect the Earth’s carbon cycle?
12 January 2024

Despite global attempts to tackle emissions, the concentration of carbon dioxide - the main greenhouse gas - continues to grow.
Our global mean surface air temperature was 1.1°C warmer in the recent decade (2011-2020) than in the pre-industrial era. This warming was indisputably caused by human activities, with anthropogenic (produced by human activity) greenhouse gases - particularly carbon dioxide - being the primary cause.
Since the advent of the industrial revolution, carbon has been transferred gradually from fossil fuel reservoirs in the earth, right up into the atmosphere through combustion.
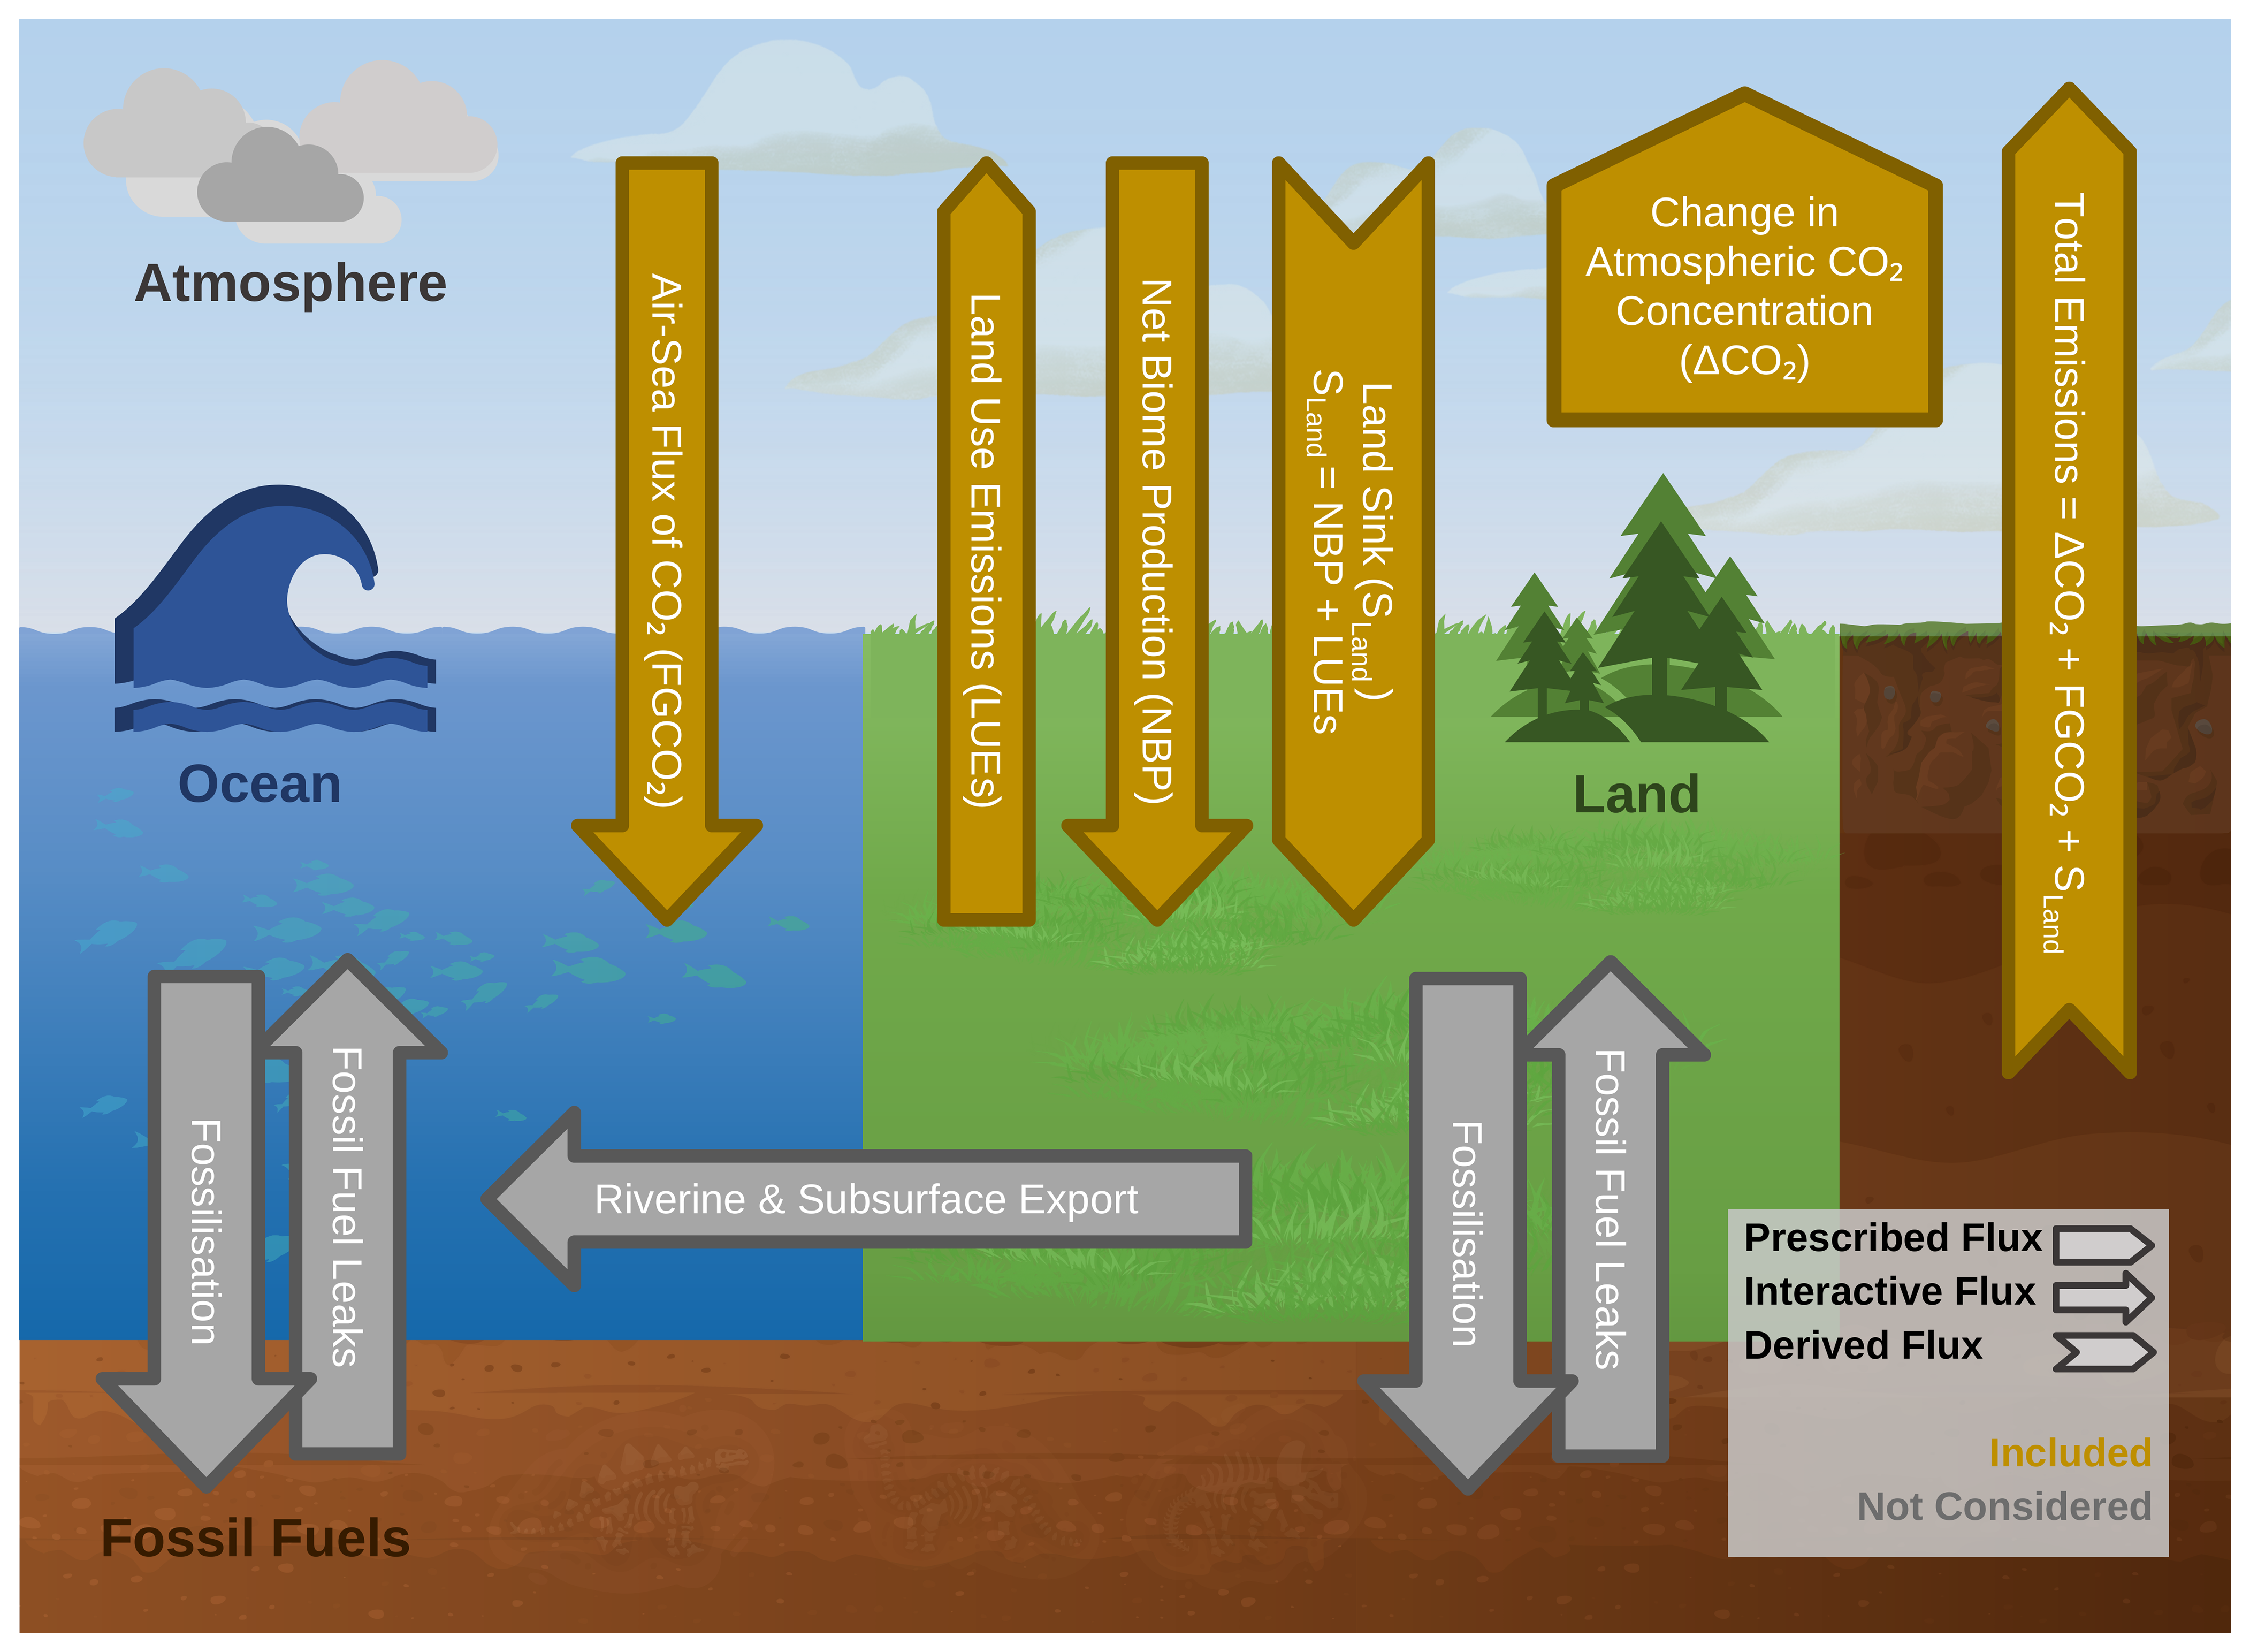
Once in the atmosphere, some of the carbon dioxide is absorbed by the ocean (via air-sea gas transfer), some is absorbed by the land surface (via terrestrial carbon fixation), while some carbon dioxide remains in the atmosphere, as illustrated below.

Above: A simplified version of the Earth System carbon cycle. Interactive fluxes are shown as arrows, prescribed fluxes are shown as box arrows, and derived fluxes are shown as chevrons. The arrows in gold are those that are considered in this study, with the grey arrows not considered.
Where carbon winds up in the Earth system has huge environmental implications and can impact global warming rates, ocean acidification, plant growth, fires and more.
As an example, with the air-sea carbon flux, around 25% of all the carbon dioxide that humans produce every year ends up in the ocean, where it changes the chemistry of the sea water, causing ocean acidification. Whilst the ocean helps us as a powerful carbon sink, it comes at a cost. As emissions continue to rise and our ocean continues to absorb carbon, the pH value of our global ocean has become 18% more acidic, from 1982 to 2021.
What does our future look like in terms of carbon allocation?
Computer models are our only tool to make projections of what our future climate might look like. Scientists from PML’s Marine Systems Modelling team have led a new study investigating the future of the carbon cycle under several possible emission scenarios and global warming scenarios. Their new publication in Earth System Dynamics, ‘Scenario Choice Impacts Carbon Allocation Projection at Global Warming Levels’ is now available to access on the European Geosciences Union.
Lead author, Dr Lee de Mora, said:
“Using data from the world’s largest climate model intercomparison project, CMIP6, we investigated the future of the carbon cycle under several scenarios, ranging from sustainable development to enhanced fossil fuel usage.
We then looked at how the group of models behaved after 2, 3 and 4 degrees of warming, relative to the pre-industrial period. These three Global Warming Levels (GWLs) were chosen because the 2°C of warming is a key target in climate policy and thought to be a threshold for potentially dangerous climate change, while the 3°C of warming is close to the warming level that we are currently on track to realise, and 4°C of warming is a low-likelihood but high-impact scenario.
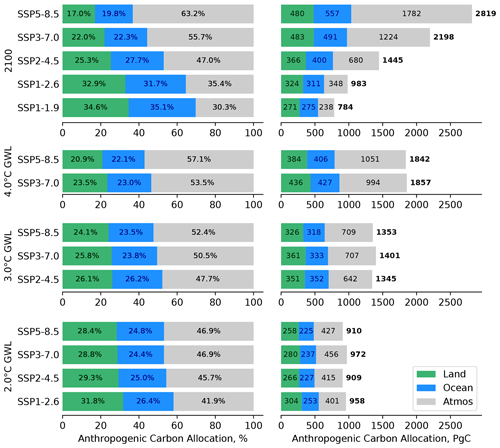
We showed that even at the warming level, the distribution of carbon between the atmosphere, land surface and ocean differs with scenario. This means that if we get to 2°C of warming, how and when we get there matters to the carbon cycle.
The differences the in carbon cycle between scenarios, even after the same warming, is equivalent to up to 63 Pg of Carbon which is about six years' worth of current global carbon emissions.
We also showed that the scenarios with faster emissions reach the same warming levels sooner, but with more carbon in the atmosphere than slower emission scenarios.”

Above: Carbon allocation for the multi-model mean for each scenario for the year 2100 and the three GWLs. The green, blue, and grey areas represent the land, ocean, and atmospheric carbon allocations. The left side shows the percentage allocation, and the right side shows the totals in petagrams (PgC) of carbon. The total values are shown in bold to the right of the bars. These values are rounded to the nearest 0.1 % or the nearest integer PgC, so the three values may not add exactly to 100 % or the total.
“These results are important for carbon budgets and mitigation strategies as they impact how much carbon the ocean and land surface could absorb at a given warming level. Carbon budgeting will be key for reducing the impacts of anthropogenic climate change, and these findings could have critical consequences for policies aimed at reaching net zero.”
Read paper: Scenario Choice Impacts Carbon Allocation Projection at Global Warming Levels >>