Story
Storms and heatwaves: the importance of maintaining long-term time-series stations
3 November 2023
As Storm Ciarán continues its journey north-east, Professor Tim Smyth reflects on its effect on the Western Channel Observatory - an oceanographic time-series and marine biodiversity reference site in the Western English Channel - and why it is so important to maintain high-frequency, long-term marine monitoring.
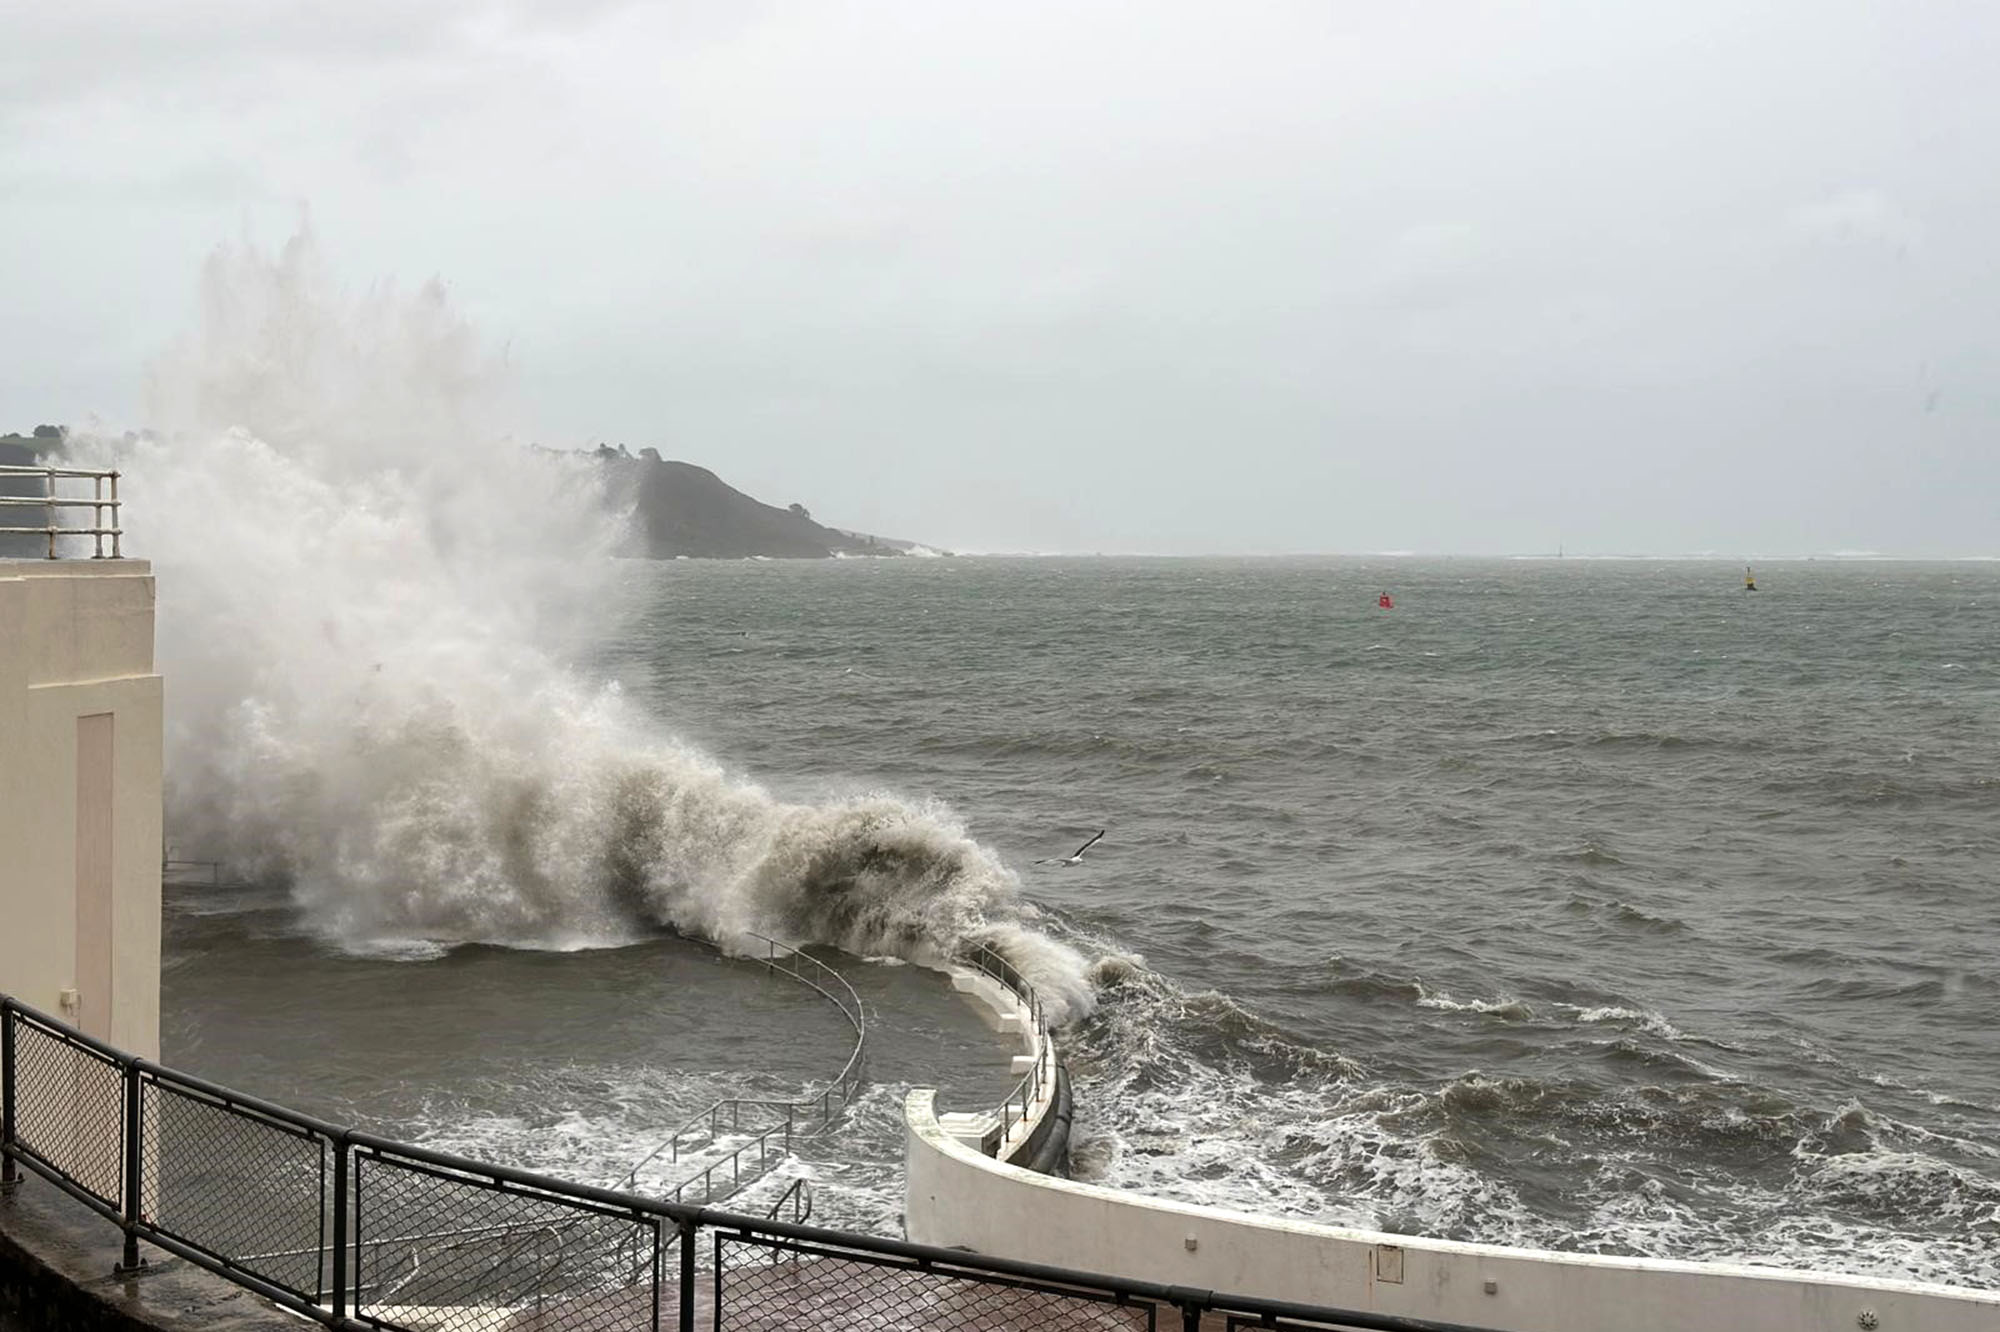
Stormy conditions at Tinside Lido, Plymouth | Brian Mercer via Lee Merchant
2023 has certainly been eventful at the Western Channel Observatory. Over the 1st and 2nd November Storm Ciarán passed directly over Plymouth, recording the UK's lowest pressure measured at 953mb by the E1 autonomous data buoy.

The strongest winds were short-lived and occurred around 07:00 GMT with gusts of 30 m/s (or 60kts) and accompanied by some very large, long period (15s) ocean waves, which reached a maximum height of around 11m!

This meteorological event highlights the importance of having autonomous instruments in the water measuring when we cannot get out to our stations on boats, and at a high enough frequency (hourly) to capture these phenomena. This year’s early summer also highlighted a related facet of our long-term sampling station at E1, and that is the need for regular sampling station visits by our research vessel RV Plymouth Quest.
E1 has the longest hydrographical data series in the world with depth-resolved measurements of temperature and salinity stretching back to 1903; a period of 120 years where we have seen considerable change to the marine environment. It is only with regular, high-frequency and high-quality data that we can begin to contextualise the marine heatwave (MHW) that occurred during June 2023.

What is clear from the left-hand plots is that the MHW conditions have increased in their frequency over the past 50 years, and extreme cold conditions have been relatively rarer in that same period; and this is not just at the surface but is a feature of the entire water column.
The right-hand plots show the seasonal cycle of temperature at the surface (2m) and at depth (50m) with the average being shown as a solid black line, and the definition of a heatwave (90th centile) or coldwave (10th centile) for a given month, being shown as the grey shading. The measurements taken during 2023 are the large circles (small dots are absolute records for a given date in other years) and dark red is where MHW conditions are observed.
During 2023 at the surface, MHW conditions existed for March through to early July, and indeed even longer at 50m. There was a brief hiatus during what can only be described as a disappointing July and August for the school summer break, then in September and October, the MHW status reasserts itself.
Both these phenomena: Marine Heat Waves, which require long-term depth resolved data sets to contextualise them, and the passage of storms, which require high frequency autonomous real-time data to capture them, emphasise the scientific necessity of maintaining our long-term time-series stations.